Graphing temperature events within a Velbus network

Hi

Inspired by a project created by Golfy, I’ve been working with an Algerian software programmer to monitor a Velbus network and create graphs based on Glass Panel thermostats, button events (ie Heating, Cooling, Boost etc) and the VMB7IN energy monitor.

In theory the app should be able to read temperature data from a VMB1TS, but I haven’t tested this.

The live results from my own home can be seen here :-

cuedup.biz/vgraphing/demoui/index.html

Each graph is created from a CSV file that the small app on a netbook, which is also running Golfy’s PB_Server, uploads to my web server every 15 minutes.

The app is easy enough to configure via a couple of XML files.

The HTML code is a little harder, but I’ve put all the important stuff into a single .JS file.

The graphs are generated by each browser using CanvasJS, which has a fantastic support group.
So if you want to do something fancy with the graphs, I’m sure you’ll get the answers in their help pages.
canvasjs.com

I’ve already identified a device in my house that is using more electricity than I realised.

I can even see which rooms take the longest to heat up, and cool down again.
Which has helped me to realise where I need to plan my next phase of home insulation.

The app still needs a few tiny tweaks, but once those have been done, I’ll upload a zipped copy for anyone to deploy.
All I ask is that you share your experience with everyone here, so that we can all get a better understanding of how Velbus Glass panels perform when used with multi-zoned HVAC systems.

For all those that have very kindly expressed an interest in testing the beta version of the graphing app that we are developing, there is now a zip file available for download.

It does not have an installer at present, but will work as a portable app, so once the HTML files and FTP access are setup, the VGraphing.exe app will function.

There are a few minor bugs in the app, but nothing that will cause a major issue.

Your assistance in shaking down this app is most welcomed.

The zip file can be found here :- mdar.co.uk/dl/

Hello everyone.

I can see from the activity logs that about 9 people have downloaded the zip file so far.

Would anyone care to share their feedback?

I’m very keen to know what scenarios it’s being used in and what kind of results people are getting.

Good or bad, the feedback is vital.

Many thanks,
Stuart

Hi Stuart,

Looked to complicated at first sight, although there is a ‘how to’ attached i’ll need to take my time to figure it out.

Greetings,
Bart

Hi Bart,

Hopefully it’s not too daunting a job to configure the software.

If you need any help, please just ask.

Best wishes

Stuart

Just to share the idea.

This is an example of how I’m using these graphs, other than just in one lump on a web page.

This is actually part of the OpenRemote integration that is currently in the ‘pre-launch’ testing phase.

http://www.mdar.eu/images/OR_Screenshots/OR_14.png

http://www.mdar.eu/images/OR_Screenshots/OR_15.png

http://www.mdar.eu/images/OR_Screenshots/OR_16.png

http://www.mdar.eu/images/OR_Screenshots/OR_17.png

Just for reference, here is the How To text,

The zip file contains a generic configuration that will probably not work until you have made extensive changes to suit your installation.

There are two parts to this app.

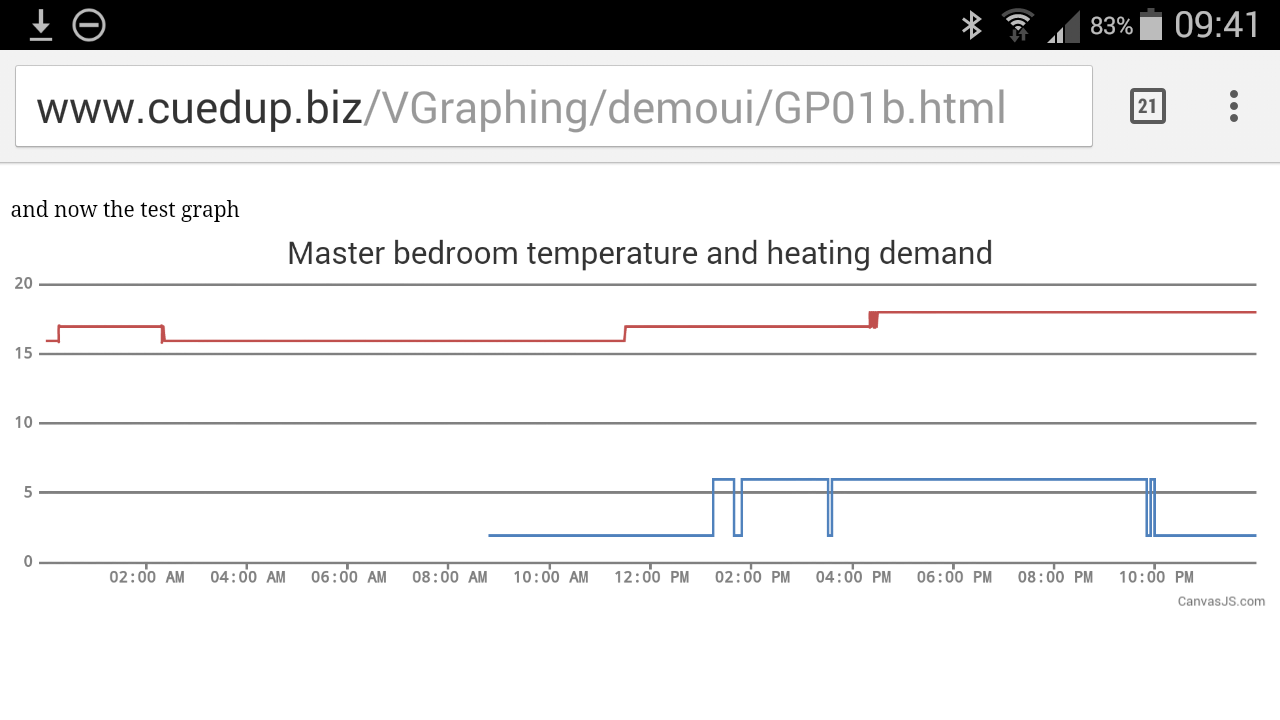
The HTML code should be loaded into your web host and is used to create the live graphs within a web browser.

A live example of the a working configuration can be found here:- cuedup.biz/vgraphing/demoui/index.html

Other than the formatting code in the normal HTML format, the graph Java code is stored within
Graphs.js
Initially you should only need to change the Title Text field for each graph to reflect your own installation.
The graphs are created using canvasJS.com code. Their support pages are extremely good.
My advice would be to stick to Line, Spline, Area or Stepline graphs, other graphs seem to expect multiple data fields.

The ServerApp files should run from your local machine.
You will need to be running a Velbus to TCP server, something like PB_Server by Golfy. Other Velbus TCP servers are available, please do report back on your success rate if you try a different server.
The Microsoft Windows ServerApp settings directs Vgraphing.exe to look at the loopback address of 127.0.0.1 and default PB_Server port of 8080
Vgraphing.exe was tested across the internet successfully, so the address can be any live Velbus TCP Server (With the exception of HomeCenter, which requires very specific application and user authentication)

The XML setting files that Vgraphing.exe uses can be found in the settings folder if you want to edit them before starting Vgraphing.
Or you can use the built in editor.
If using the built in editor, you will need to restart the server app for the changes to take effect.
My advice would be to backup your XML setting files before you edit them, just as a precaution.
The four setting files are:-
button.xml
energy.xml
settings.xml
temperature.xml

setting.xml

This file contains the FTP URL, username, password and security type.
The upload interval and quantity of each graph you wish to create.
should point to the root of your FTP server


- This is set to FTPS, we haven’t tested the standard FTP version.
- This should point to the CSV subfolder of your web host, where your CSV files will be accessed by the HTML / Java Code. (Within Graphs.js)
- This is the interval between uploads, in minutes.
isn’t used anywhere in the app as yet.
Nor is ,
This is the IP address of your Velbus Server, the default loopback address of 127.0.0.1 is currently set, however the app can work across the internet if the correct port forwarding or VPN setttings are in place.
This is the port that is serving out Velbus TCP data, PB_Server default port is 8080
This is the number of temperature graphs you want to display, It has been tested up to 30 graphs. In theory more are possible.
This is the number of energy monitoring graphs you want to show. We have only tested the app with 3 energy graphs.
This is the number of button events you wish to graph. While it theory you can graph any button events, the app was designed to look for Heater, Cooling, Pump etc, these will show well on a graph as the “Pressed” and “Released” events are normally quite well spaced. If you test the app with other button events, please report back on your success rate.
This isn’t used anywhere in the app as yet,
This time is used to determin when in a 24 hour period you wish to create an archive and reset the uploaded CSV files, I would suggest leaving the setting to 23:59, as this will create the archive just before midnight and therefore use the correct date for the folder name. There is a tiny cliche that the very next CSV entry might appear as 23:59.5 etc
This isn’t used at present.

Temperature.xml

Please ensure your glass panel is set to transmit data at least once during the upload inteval.

- this is the Ident that the server app will use to create the CSV file Address in Hexadecimal format - Temperature data is transmitted by the Glass panel base address - not the thermostat address Title is only used in the log display This is the file name to be uploaded 31 Guest Head board GP02.csv Repeat the above format for all the required temperature graphs.

energy.xml

Base address in Hexadecimal format Assign channels Ch1 = 1, Ch2 = 2, Ch3 = 3, Ch4 = 4 The name used in the app log Not currently used in the app The multiplier used to gain the correct current consumption value. Electricity is normally a multipler of 1 Not currently used in the app Not currently used in the app This is the name of the file to be uploaded 2A 2 Gas M3 M3 0.001 NULL NULL EM02.csv Repeat the above format for all the required energy graphs.

button.xml

Base address in Hexadecimal format Assign channels numbers as 1, 2, 3, 4, 5, 6, 7 or 8, rather than the bit placement format of 01, 02, 04, 08, 10, 20, 40 & 80 Name to be used in the app log Filename to use to upload the CSV file A3 1 Guest Ensuite BT02.csv Repeat the above format for all the required button graphs.

Hello

Tahar has just issued a slightly updated version of the core EXE file.

It attempts to cope with moments of excessive data on the Velbus network.

The date and time field has been reverted to time only to make it easier on the eye in the graphs.

I was having a problem with my FTP server locking me out, which we think was simply because the app was connecting too many times, in too short a period.

I’m currently testing it with a 30 minute upload interval.

If you’d like to try the new EXE, it can be found here

mdar.co.uk/dl/vg/Vgraphing.exe

There is also a small tweak going on with the CanvasJS script in an attempt to show button events on the same time line as temperature graphs.

There is an example here.

cuedup.biz/VGraphing/demoui/GP01b.html

Hi

Just a tiny update.

I’ve worked out what the multiplier to achieve a water measurement in Litres per minute.

My sensor outputs 400 pulses per litre.

So the VMB7IN is set to 400 pulses.

This outputs a reading for Liters per hour as its instant value, and correctly measures the consumption.

To get the graphing app to display Liters per minute, the app should use a multiplier of 0.00001667

Stuart,

Could you explain me the data flow, to help me understand the complete picture? I’m not doing this on daily base, this is hobby that got out of hand. So excuse me if I ask stupid questions.

In my case i’m interested in graphing kWh counter as a starter, so i’ve configured the address from my VMB7IN, channel 8 (through vgraphing.exe, could have changed energy.xml directly)
Of course I’ve paid attention to the general settings and filled them out, although I doubt about the FTP security setting. Is there a way I can test the FTP connection/upload?
Anyway, I’ve uploaded the html files on an ftp server and they are reachable.

But now, what is the data flow?
kWh counter ‘saves’ the values in VMB7IN -> Vgraphing which runs on my computer reads them out (through my Home center connection) -> Vgraphing uploads the file EM01.csv
I assume VMB7IN logs this with time stamp, now I’ve set the counter update to 10 seconds… how many stamps can de log contain?

Many many questions will follow :wink:

As usual thanks for the info’s!

Greetings,
Bart

Hello Bart :slight_smile:

I like how you’re thinking, but maybe I should have been more clear.

For a start, forget about Home Centre, it isn’t accessed at all by the graphing app, come to think of it, strictly speaking the app doesn’t poll the VMB7IN either.

So let’s go through this, step by step :slight_smile:

Your VMB7IN.

I assume you mean Hex channel 08? Rather than input no 8… Which would really confuse me.

You have your KWH pulse connected to input number 4 on your VBM7IN?

The VMB7IN needs to be set to transmit the counter data into the bus either at regular intervals, or whenever it changes.
If you’ve set your counter to update every 10 seconds, you’ll see an incredible amount of data points.

This is done via the Configure Module options in VelbusLink. (In a very similar way to your thermostat issue.)

Home centre and your Oled panels will pick up this transmitted data and do whatever they do with it all.

In order for the VGraphing app to collect these packets of data it must connect to a Velbus to TCP server, which in turns connects to your Velbus network via its own RS232 or USB connection.

Something like Version 6 of VelbusLink, Golfy’s PB_Velbus server, or any other server app that is featured in this forum.

Once it has a connection to a TCP data stream it will filter in the packets that the various XML files call for.

Buttons, energy and thermostat.

In the logging window, (the only window, unless you open the XML files for editing) you’ll see each filtered bit of data arrive, alongside a time stamp.

Currently it is only saved in memory until an updated CSV file is uploaded to your FTP site.

You’ll see the app attempting each CSV upload in the same window.

However at the moment there isn’t a message if the upload fails.

As for how many entries are permitted, to be honest I have no idea.
It just keeps adding them to the CSV file.

My VMB7IN is set to transmit data every time the value changes, so whenever any of the 3 energy counters change, I see 3 packets of data.

If you look at the EM01, EM02 & EM03 graphs on my site you’ll see lots and lots of data points.

Whereas the thermostat entries are only every 255 seconds.

Button events are handled ever so slightly differently, but only so that the graphs have a few more data points.

Does this help you?

Best wishes

Stuart

Hi there,

VMB7IN - Deciamal address = 41
counter is on CH1 = input 1 (thought it was CH8…)
Sending BUS data every 30 seconds (which i can see in the Velbuslink logging)

VGraphing is configured with the LAN IP/port of my HomeCenter due the lack of direct BUS <-> USB computer connection.
So here is my mistake, the TCP data should come from the computer, not from the HomeCenter…?

Assuming the white surface in VGraphing is the place where logging is showed as well?

Greetings,
Bart

Morning Bart.

Okay… I see the problem/s.

The energy.xml file for the app needs to be looking at the HEX version of the base address of your VMB7IN, which would be 29 (Dec 41 = Hex 29)

Then it needs to be looking at input number 01 (not 1, very specifically 01)

The next issue is probably the biggest.

VGraphing can’t work with HomeCenter because HomeCenter has a very specific log in process that we don’t want to reverse engineer.

It really must connect via another server.

You could unplug your HomeCenter to use the USB adapter, just to prove the software works.

If you run the Velbus server on the same pc as VGraphing, you can use the loop back IP address of 127.0.0.1

Does this help?

Cheers

Stuart

Meanwhile, computer is connected through USB

And I’ve applied the changes, including the ‘‘internal’’ IP 127.0.0.1 port 8080
But i don’t see anything passing, neither the EM01.csv is updated. Where does the file has to be? In the same directory as VGraphing.exe or can i keep the structure as it is in the .zip file?

29 01 Electricity W Watts 1 NULL NULL EM01.csv

Greetings,
Bart

Right…

First question… Probably an obvious one…

Have you restarted the VGraphing app since you made the changes?

The XML files are all in the settings folder, but the energy config looks good to me.

The CSV files are created in memory and uploaded to the FTP site at the intervals you set in the Setting.XML file.

Apart from somewhere around midnight, depending on the time you set in the settings file, when they are all dropped into a local dated archive folder.

However, if you don’t see anything appearing in the window, I’d say that one of the following is the cause.

  1. The app hasn’t reset and achieved a connection to the Velbus to TCP server. (It doesn’t connect directly to the USB port, it must go through a server app. This is because in the bigger picture the Velbus server app will be supplying bus data to OpenRemote too. Thus reducing the need for multiple USB ports)
    Which server app are you using?

  2. The VMB7IN isn’t transmitting data.
    Try configuring some temperature address’ too, that way you’ll know if data is being received

3… I can’t think of a 3 right now.

Just to be clear, which Velbus to TCP server are you using?

PB_Velbus server?

golfy.olympe.in/Teo-Tea/category/vmbserver/

All right, getting closer and closer. But definitely need some sleep before i make more mistakes :slight_smile:

See general settings below, left the FTP stuff away. This isn’t mandatory for the moment (and have to check FTP security).
This is missing: ???

vgraphing.css Yes ftp.xxxxxxxxx.xx xxxxxxxxxxx xxxxxxxxxxx FTP /csv 10 http://xxxxxxxxxxxxxxxxxxxxx /ftp_vb PB_Velbus Server 3.21 127.0.0.1 8080 20 01 01 5 00:05 90

Anyway Golfy’s server is up and running… nothing passes yet through VGraphing…
http://s23.postimg.org/xqgvuuvej/2015_07_22_00h10_05.png

Followed your advice and ‘activated’ temperature. --> Victory!
Bad news = no energy and VGraphing.exe is quite unstable. Stops working, windows fault. Have been testing with the ‘old’ version, same result.

http://s12.postimg.org/nus43mv59/2015_07_22_00h42_26.png

Hello Bart

I’m glad to hear that you’re now getting something from Vgraphing, although I’m very concerned that it’s crashing.

The test rigs I’ve got running only crash when I send very large amounts of reprogramming packets.

I’m hoping that if we resolve the issue with the energy minor that it will stop crashing.

Thanks for sticking with this.

To the energy monitor.

According to the data packets that you’ve shown in your screen grab, your energy monitor is sending from input No 6, Hex channel 20

Which is extremely odd, considering only the first 4 inputs are energy monitoring.

So, please change the energy. Xml file to look for base address 29 and channel 20

Restart the app

You should start seeing energy data in the log window.

Can I ask which firmware you have in your VMB7IN?

Good luck

Stuart

I’ve looked at your general settings again.

You might have a problem with your FTP server locking you out, but only because you’ve set the update interval to 10 minutes.

I started with 15 minutes, but 1and1.co.uk server kept locking me out, until I set the interval to 30 minutes.

Also, I’ve only tested the FTPS function, please let me know how you get on with the non secure FTP version.

Cheers
Stuart

ah ok, VGraphing is crashing due to a manipulation of me.
Found out why, when i open velbuslink and connect to velbus (tcp/ip) and scan the installation VGraphing crashes. Which is plausible :wink:

http://s13.postimg.org/qhx9q1ss7/2015_07_22_20h01_03.png

The energy metering keeps me busy. For test purpose i’ve changed the address to hex 55, changed it in energy.xml, restart vgraphing.exe. No result…
VMB7IN has the 1439 build

http://s4.postimg.org/jwdyfwf7x/2015_07_22_20h17_32.png

Arrrr I see.

Yes, that is the same cause of crashing that I’m getting.

There must be a particular packet that is upsetting Vgraphing.

Okay.

So, you’ve changed the base address of the VMB7IN to Hex 55, and reflected that in the Energy.XML file.

But, did you also change the channel number to 20, as that is what the log in VelbusLink & PB_Server is showing.

BE is the code for an energy reading.

The very next byte is the code for the channel, which for some reason in your system is 20.